We try to predict the conformation of the
polypeptide backbone, i.e. the phi/psi torsion angles from the amino acid
sequence. The first step has been to re-investigate the distribution of phi-psi
angles, i.e. the Ramachandran plot, of each of the 20 individual amino acids.
We have used a set of over 1000 non-homologous subunits, whose structures have
been determined by X-ray crystallography to high accuracy (resolution 2.0
≈ngstrˆm or better and refined to an R-value of under 20%. In total 237 000
amino acid residues were used. The amino acids have been subdivided into
different categories, such as alpha-helix, beta-sheet or random coil. These
results are published in Acta Cryst D58 (2002) 768-776. Click here to download a reprint of the paper in PDF
format.
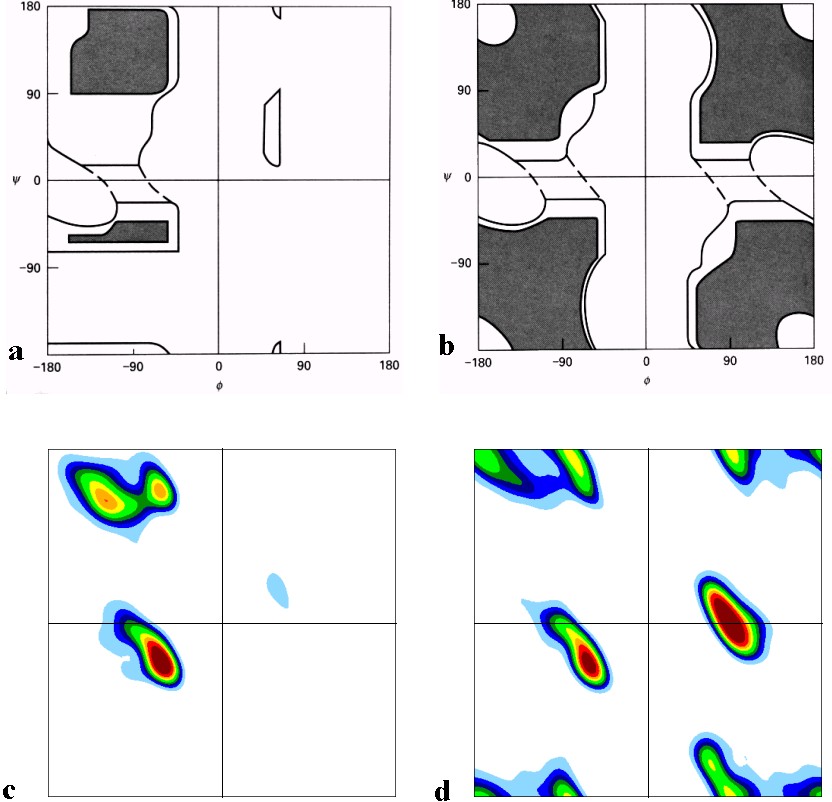
Figure 1 The classical version of the Ramachandran plot for a) alanine (but often taken
as typical for all non-glycines) and b) glycine according to Ramachandran and Saisekharan, 1968.
The fully allowed regions are shaded, the partially allowed regions are enclosed by a solid line.
The connecting regions enclosed by the dashed lines are permissible with slight flexibility of bond angles.
These plots were arrived at by computer modelling. Although some overall features of these plots are correct,
the details differ from the experimentally observed Ramachandran plots for c) all 19 non-glycines and d) glycine.
The most remarkable differences are that
1. Most regions show a 45 degree slope rather than being parallel to any of the axes
2. The þ-sheet region is split into two distinct maxima
3. The two most populated regions for glycine seen in d) were predicted
to be only just permissible as shown in b).
4. The corner region of Gly is allowed, although it was predicted not to be.
The paper in Acta Cryst D contains individual Ramachandran plots for each of the 20 amino acids
showing their distinct individual distribution of phi/psi angles.
Copyright © International Union of Crystallography
Acta Cryst. D58, 768---776